Ridgeline:
Responsibilities: Business-as-usual and conceptual feature design for Ridgeline’s Trading & Post-Trade vertical, as well as significant contributions to the platform design system.
Role:
Staff Product Designer (Trading/Post-Trade)
Business Impact:
– Managed the design for 3 trading-oriented verticals
– Redesigned the Platform Data Table for more functionality and usability.
– Contributed many features to the general design system
– Created a framework for producing vertical app maps used by other designers
Company:
Ridgeline
Skills:
– Interaction Design
– Visual Design
– Design Systems
– Developer Handoff
Timeframe:
1 Year
Project Overview
Context and Challenge: Ridgeline is an all-in-one platform for asset managers, comprised of portfolio management, trading, accounting, reporting, and other features. I was brought on to own the Trading vertical. When I joined, most of the core trading functionality had been designed and built, and the developers were focused on improving performance. My role was to apply my previous “trading design” knowledge to enhance what had been built as well as design out new features. While there were new features such as algo trading, a lot of my focus was on improving existing platform functionality, both in trading and the general design system, which required me to navigate Ridgeline’s corporate culture to champion the benefits of proposed enhancements
Approach: My strategy was clear-cut. For new features, I collaborated with the product manager to define our objectives, then designed a user-friendly experience, working with developers to bring it to life. Improving existing features involved drafting clear reasons for enhancements, creating visual concepts for a better experience, proposing temporary fixes when needed, and securing approval and resources to implement these changes.
Outcome: I made substantial contributions at Ridgeline that not only elevated the Trading vertical but also enriched the entire design system. Among my successes were:
- The design and implementation of a bespoke, platform-wide blotter system, superseding a third-party solution.
- The design of a generative Algorithmic Trading System.
- The creation of a Order Ticket Framework.
- The establishment of a consistent Messaging and Alert Framework, enhancing clarity across the application.
- The conceptualization and planning for a streamlined, unified Post-Trade experience.
- The design of refined, atomic components such as date pickers, number spinners, sliders, and list alert blocks.
- The introduction of features critical to modern trading operations, including Mutual Fund Trading, Multi-currency, Merged/Bulk orders, Dark Pools, FIX, and seamless integration with external trading systems.
Successes and Obstacles
Third-Party DataGrid Evaluation and Replacement
After identifying limitations with the AG Grid third-party table implementation, led the charge in evaluating its capabilities, advocating for a custom-built table system, and overseeing its design. This process involved overcoming initial resistance and coordinating closely with the design systems team.
Enhanced Post-Trade Experience
Conceptualized and initiated the planning for a streamlined, unified Post-Trade view, tackling the complex challenge of merging disparate systems into a cohesive user experience. While there was some resistance to this, I developed an interim system to demonstrate the feasibility and benefits of the unified approach, facilitating a smoother transition.
Trading Ticket Redesign and Messaging Standardization
Addressed the rudimentary design of trading tickets by implementing standardized contextual information, design formatting, and messaging frameworks, significantly improving the trade execution process.
Designing a Flexible Algo Trading System
Undertook the complex task of analyzing multiple algo forms to design a generative system that would accommodate any algo form without breaking the design system or hierarchy.
App Map Diagrams
I developed a standardized template for Flow Diagrams/App Maps, which became the foundational guide for other designers to illustrate the interactions between their specific verticals and the broader Ridgeline System. This approach aimed to present a comprehensive view of the extensive system architecture at Ridgeline.
Improved Design System Components
Created refined, atomic design components such as date pickers, number spinners, sliders, and list alert blocks, contributing to a more intuitive and efficient user interface.
Selling Initiatives
As Ridgeline was a larger startup, with a mature design team, and a built out initial platform, I had to work harder than normal to advocate for improvements, optimizations, or new ways of doing things. Results were various new components, more efficiency in Post-Trade in the works, and a more polished platform.
Ridgeline Trading Platform

- Journey Maps
- Disseminating Knowledge to Coworkers
- Designing within the Trading & Post-Trade Verticals
- Design Systems
- Designing in Google Sheets
Before & After Comparison
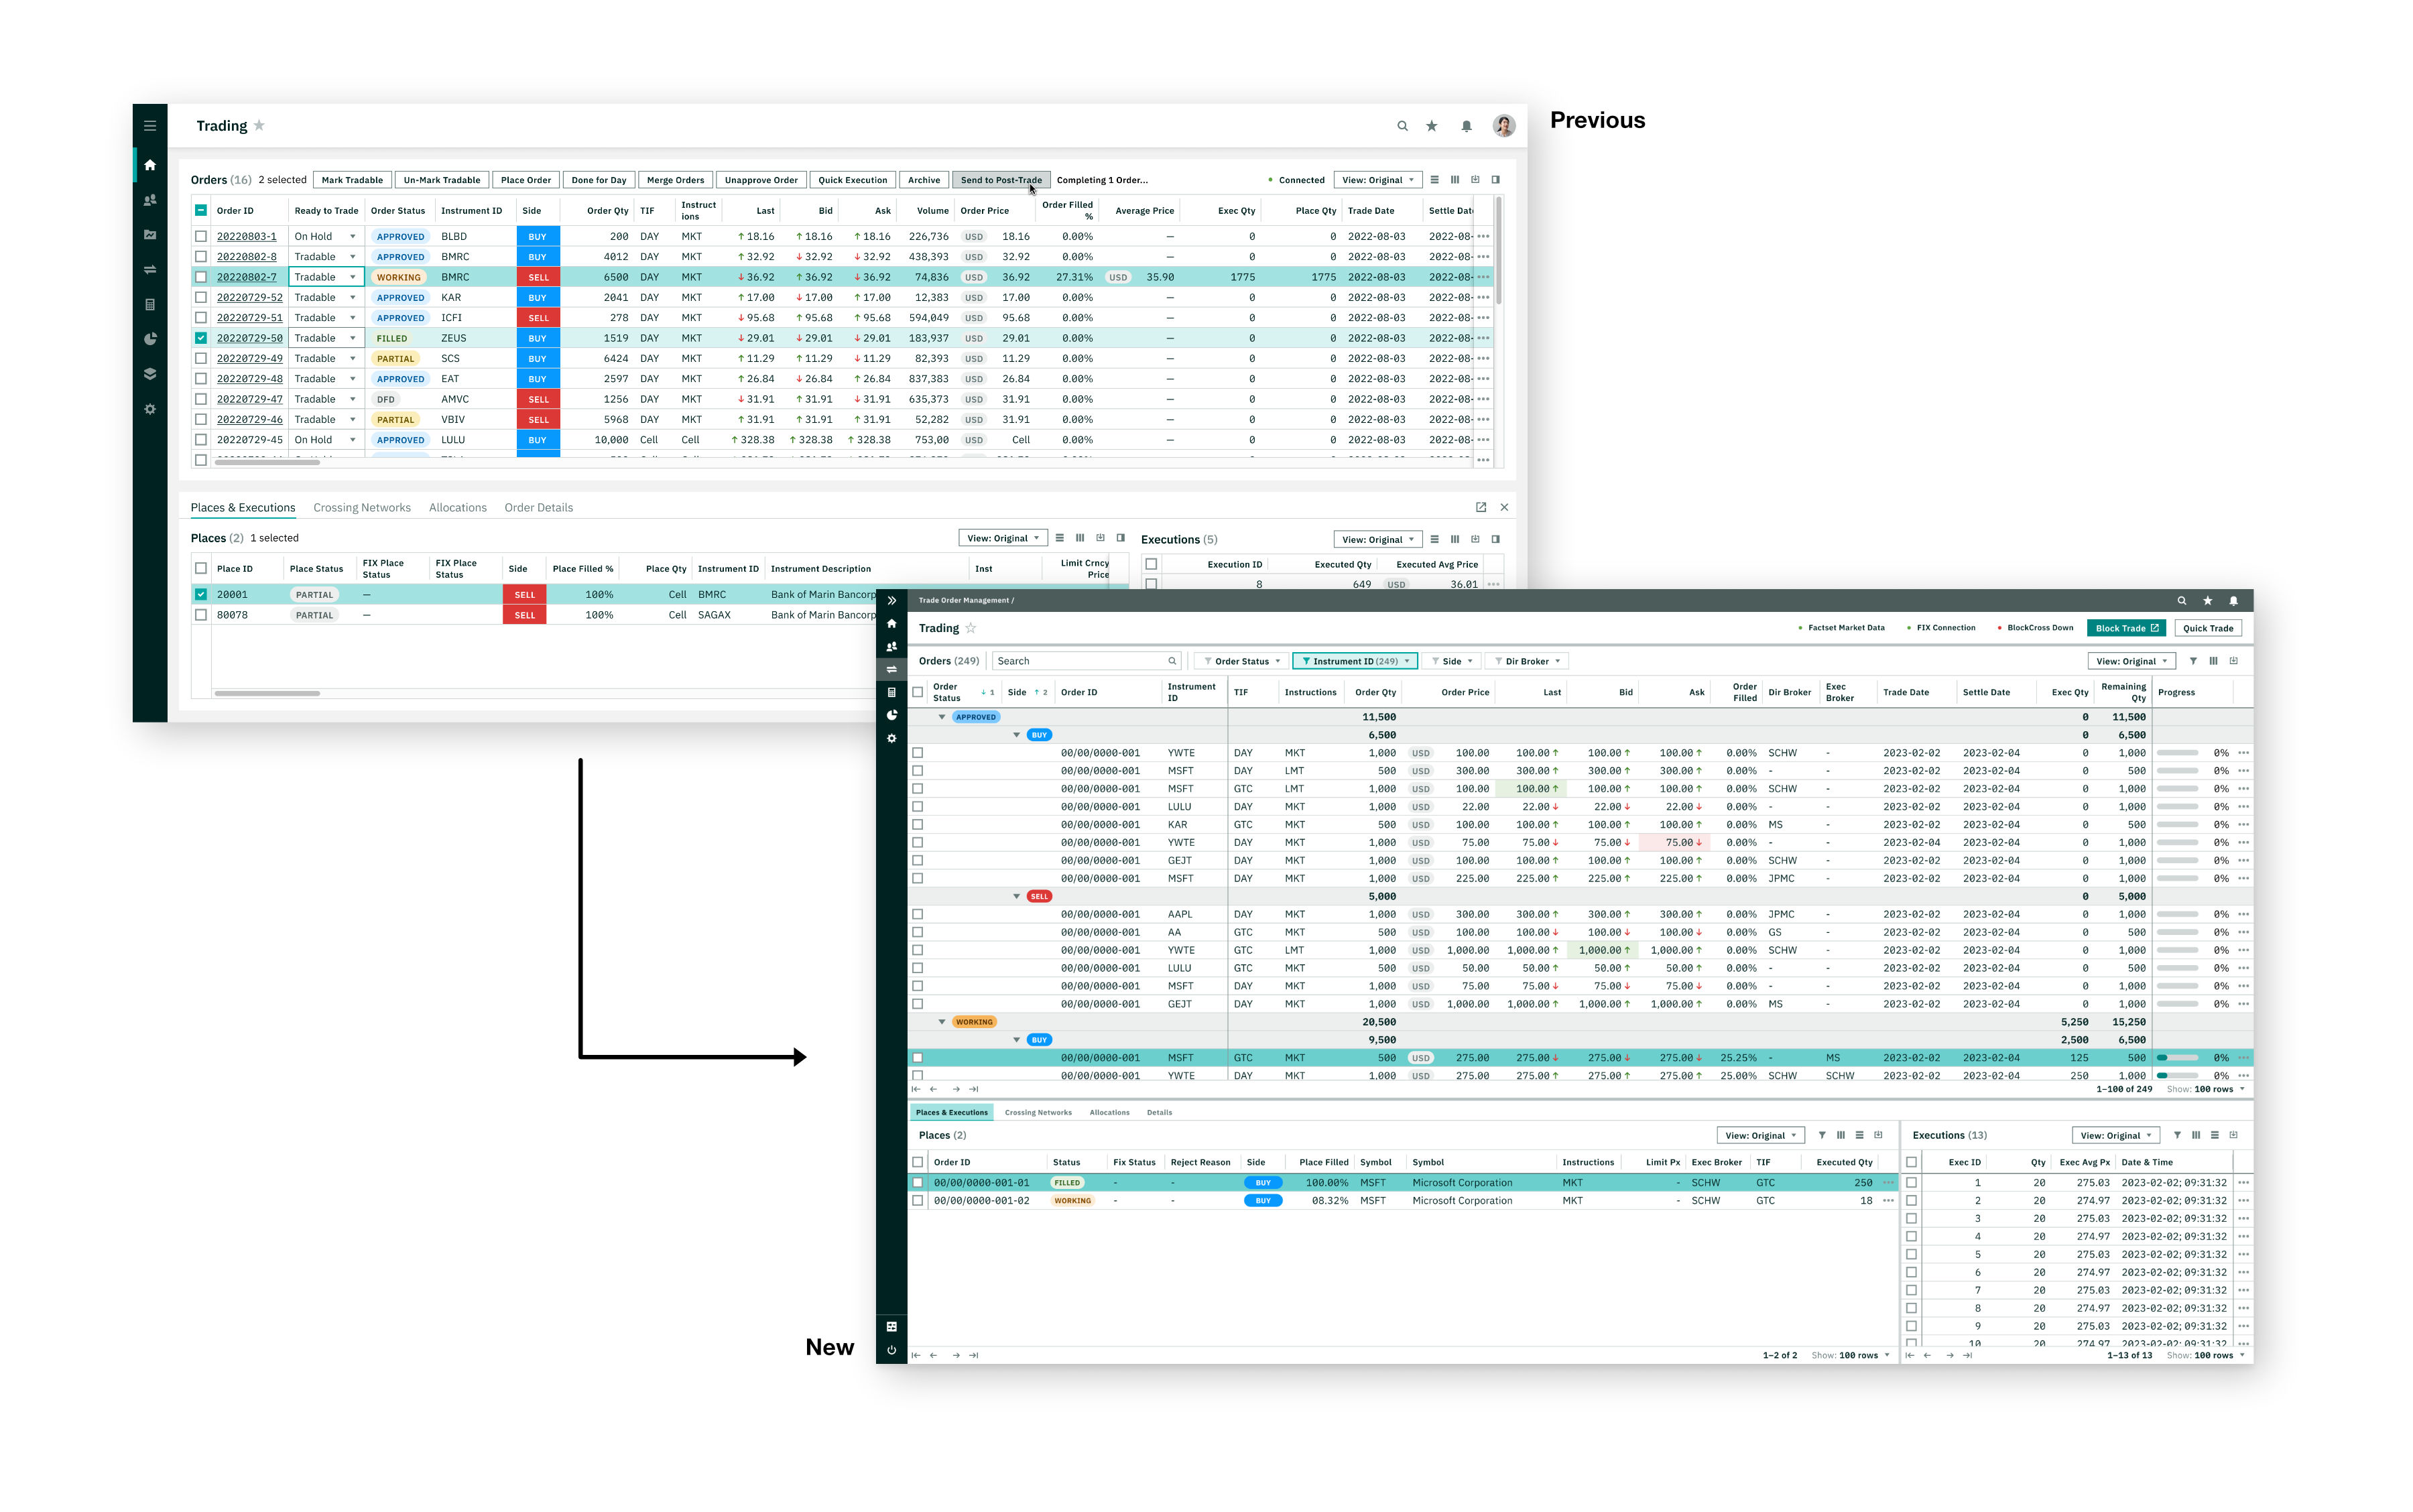
- Before and After shots comparing the Ridgeline trading vertical, prior to and after my joining the company
- Highlights my contributions to streamlining the experience as well as the design system.
Vertical Info Share Presentation
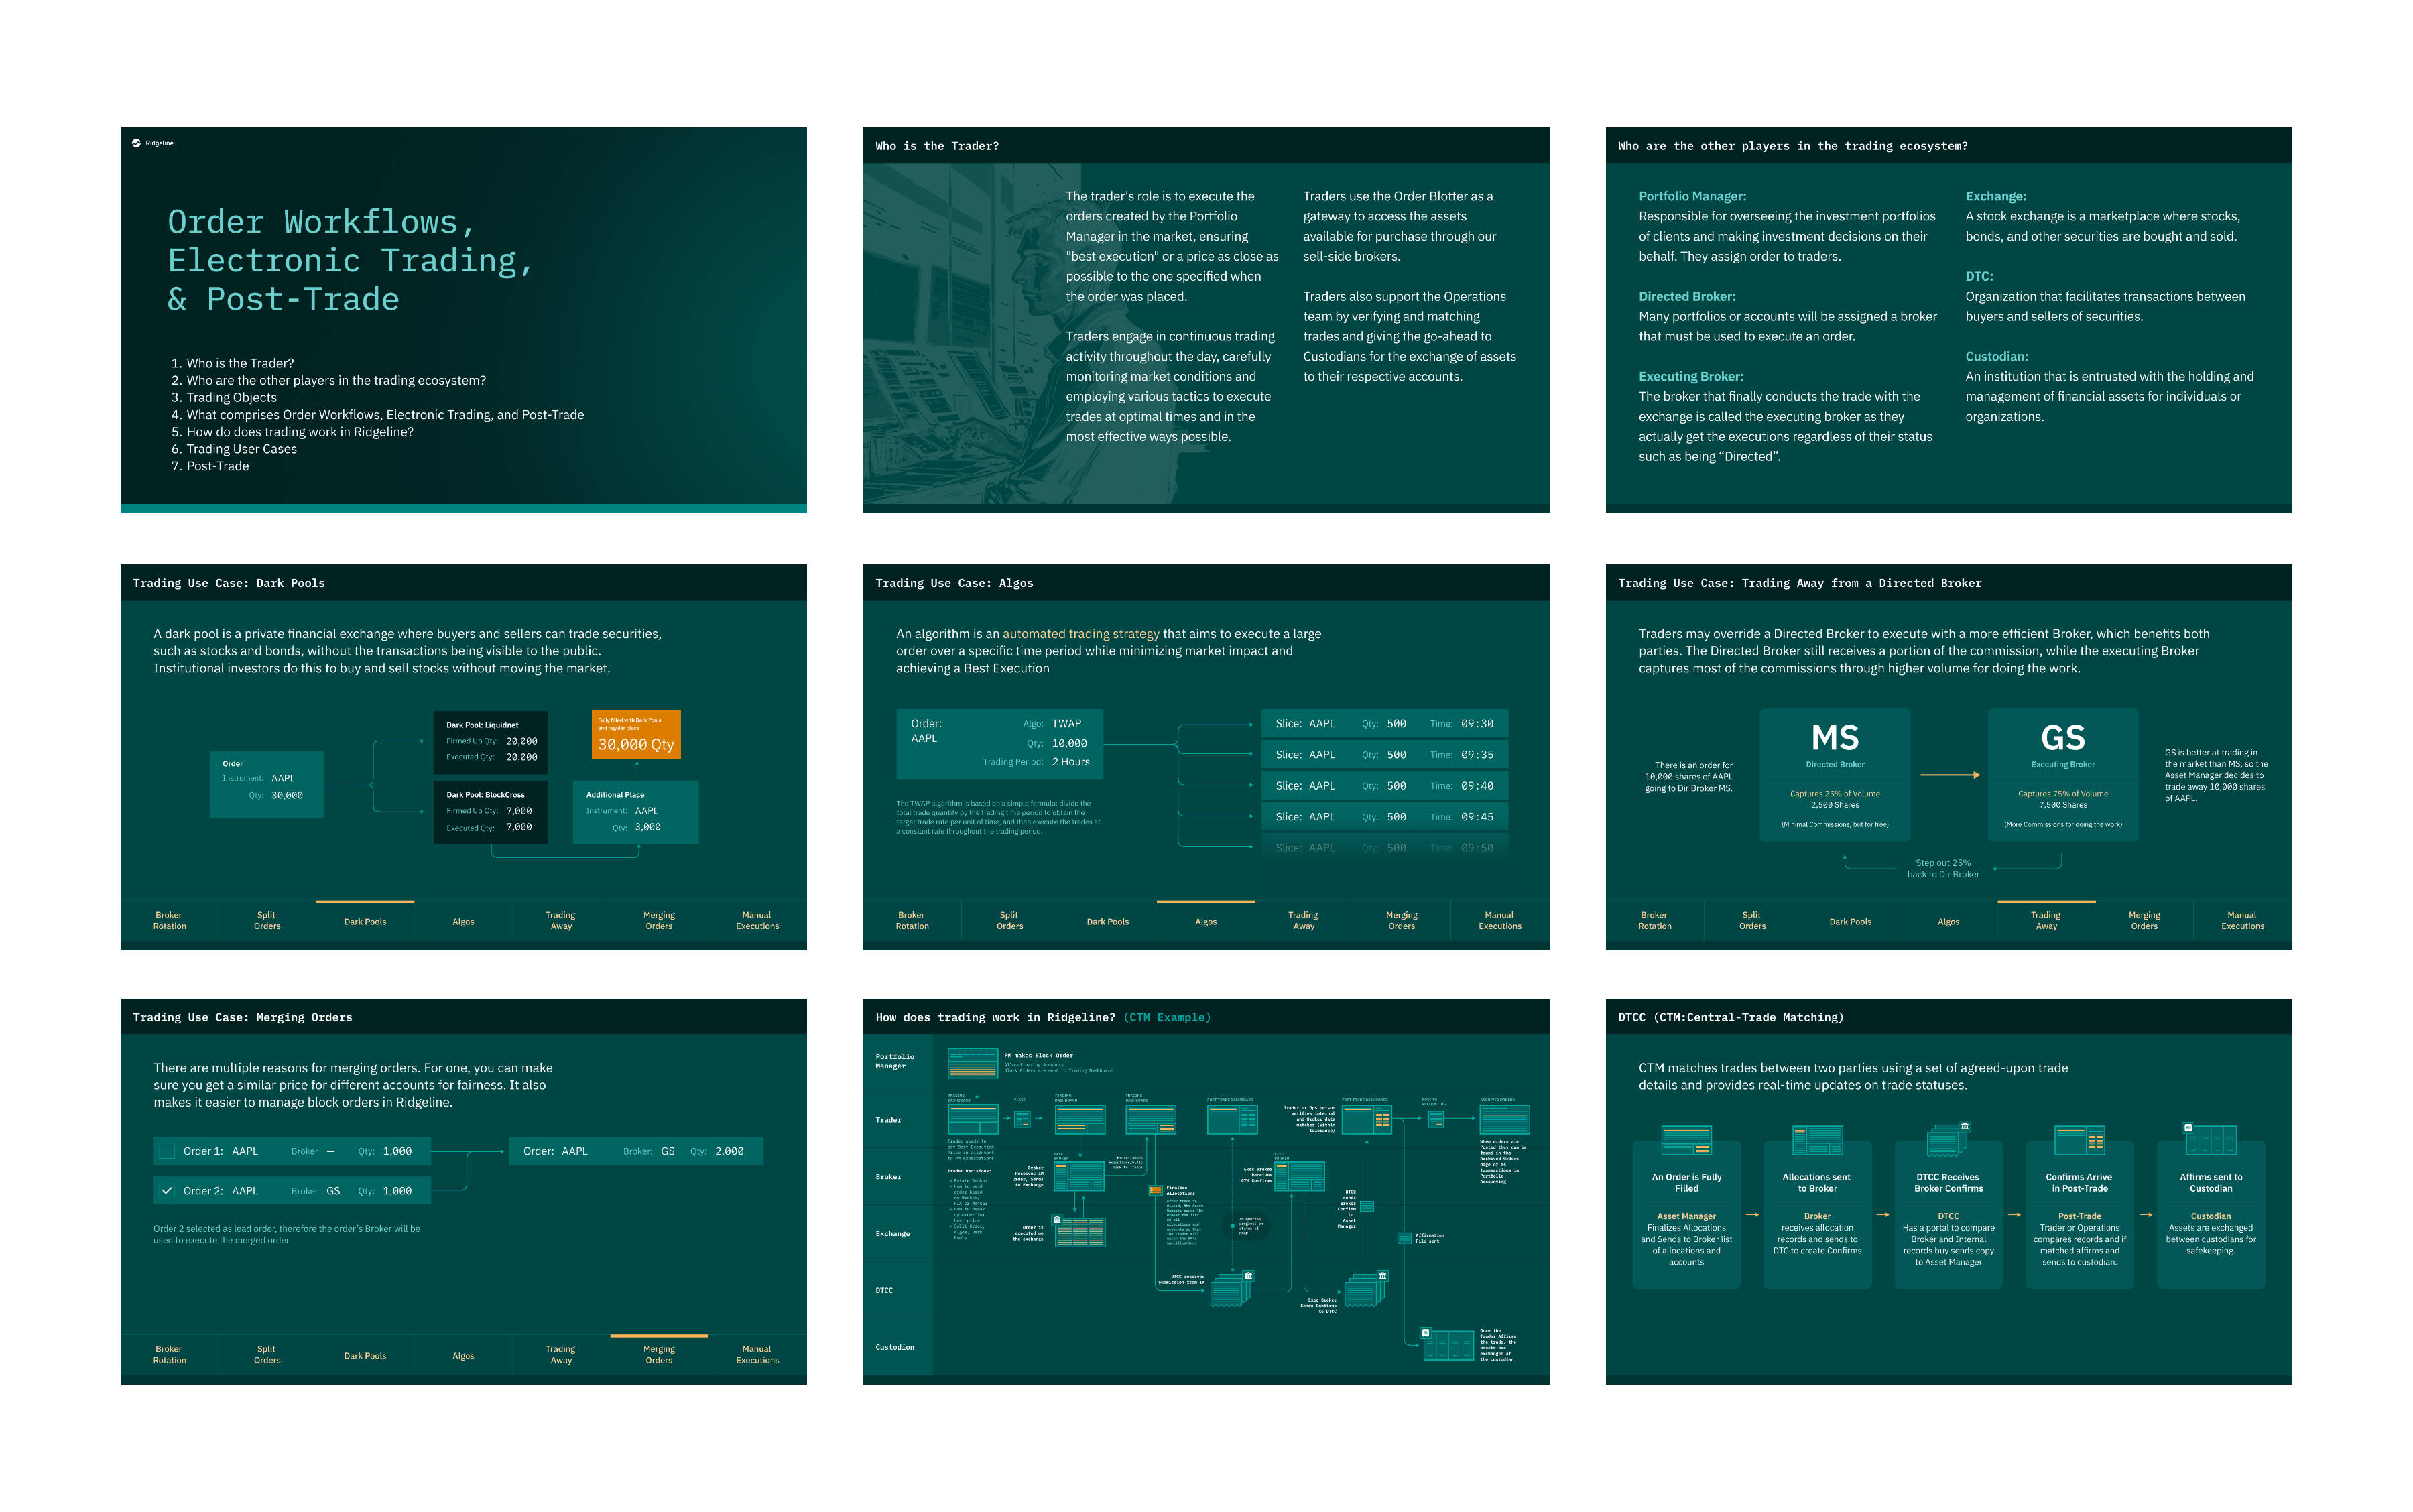
- After having joined the company for a few months, most of the designers produced a video and deck presentation of the vertical they owned.
- Here are the key slides of the presentation I gave.
Full View of Vertical
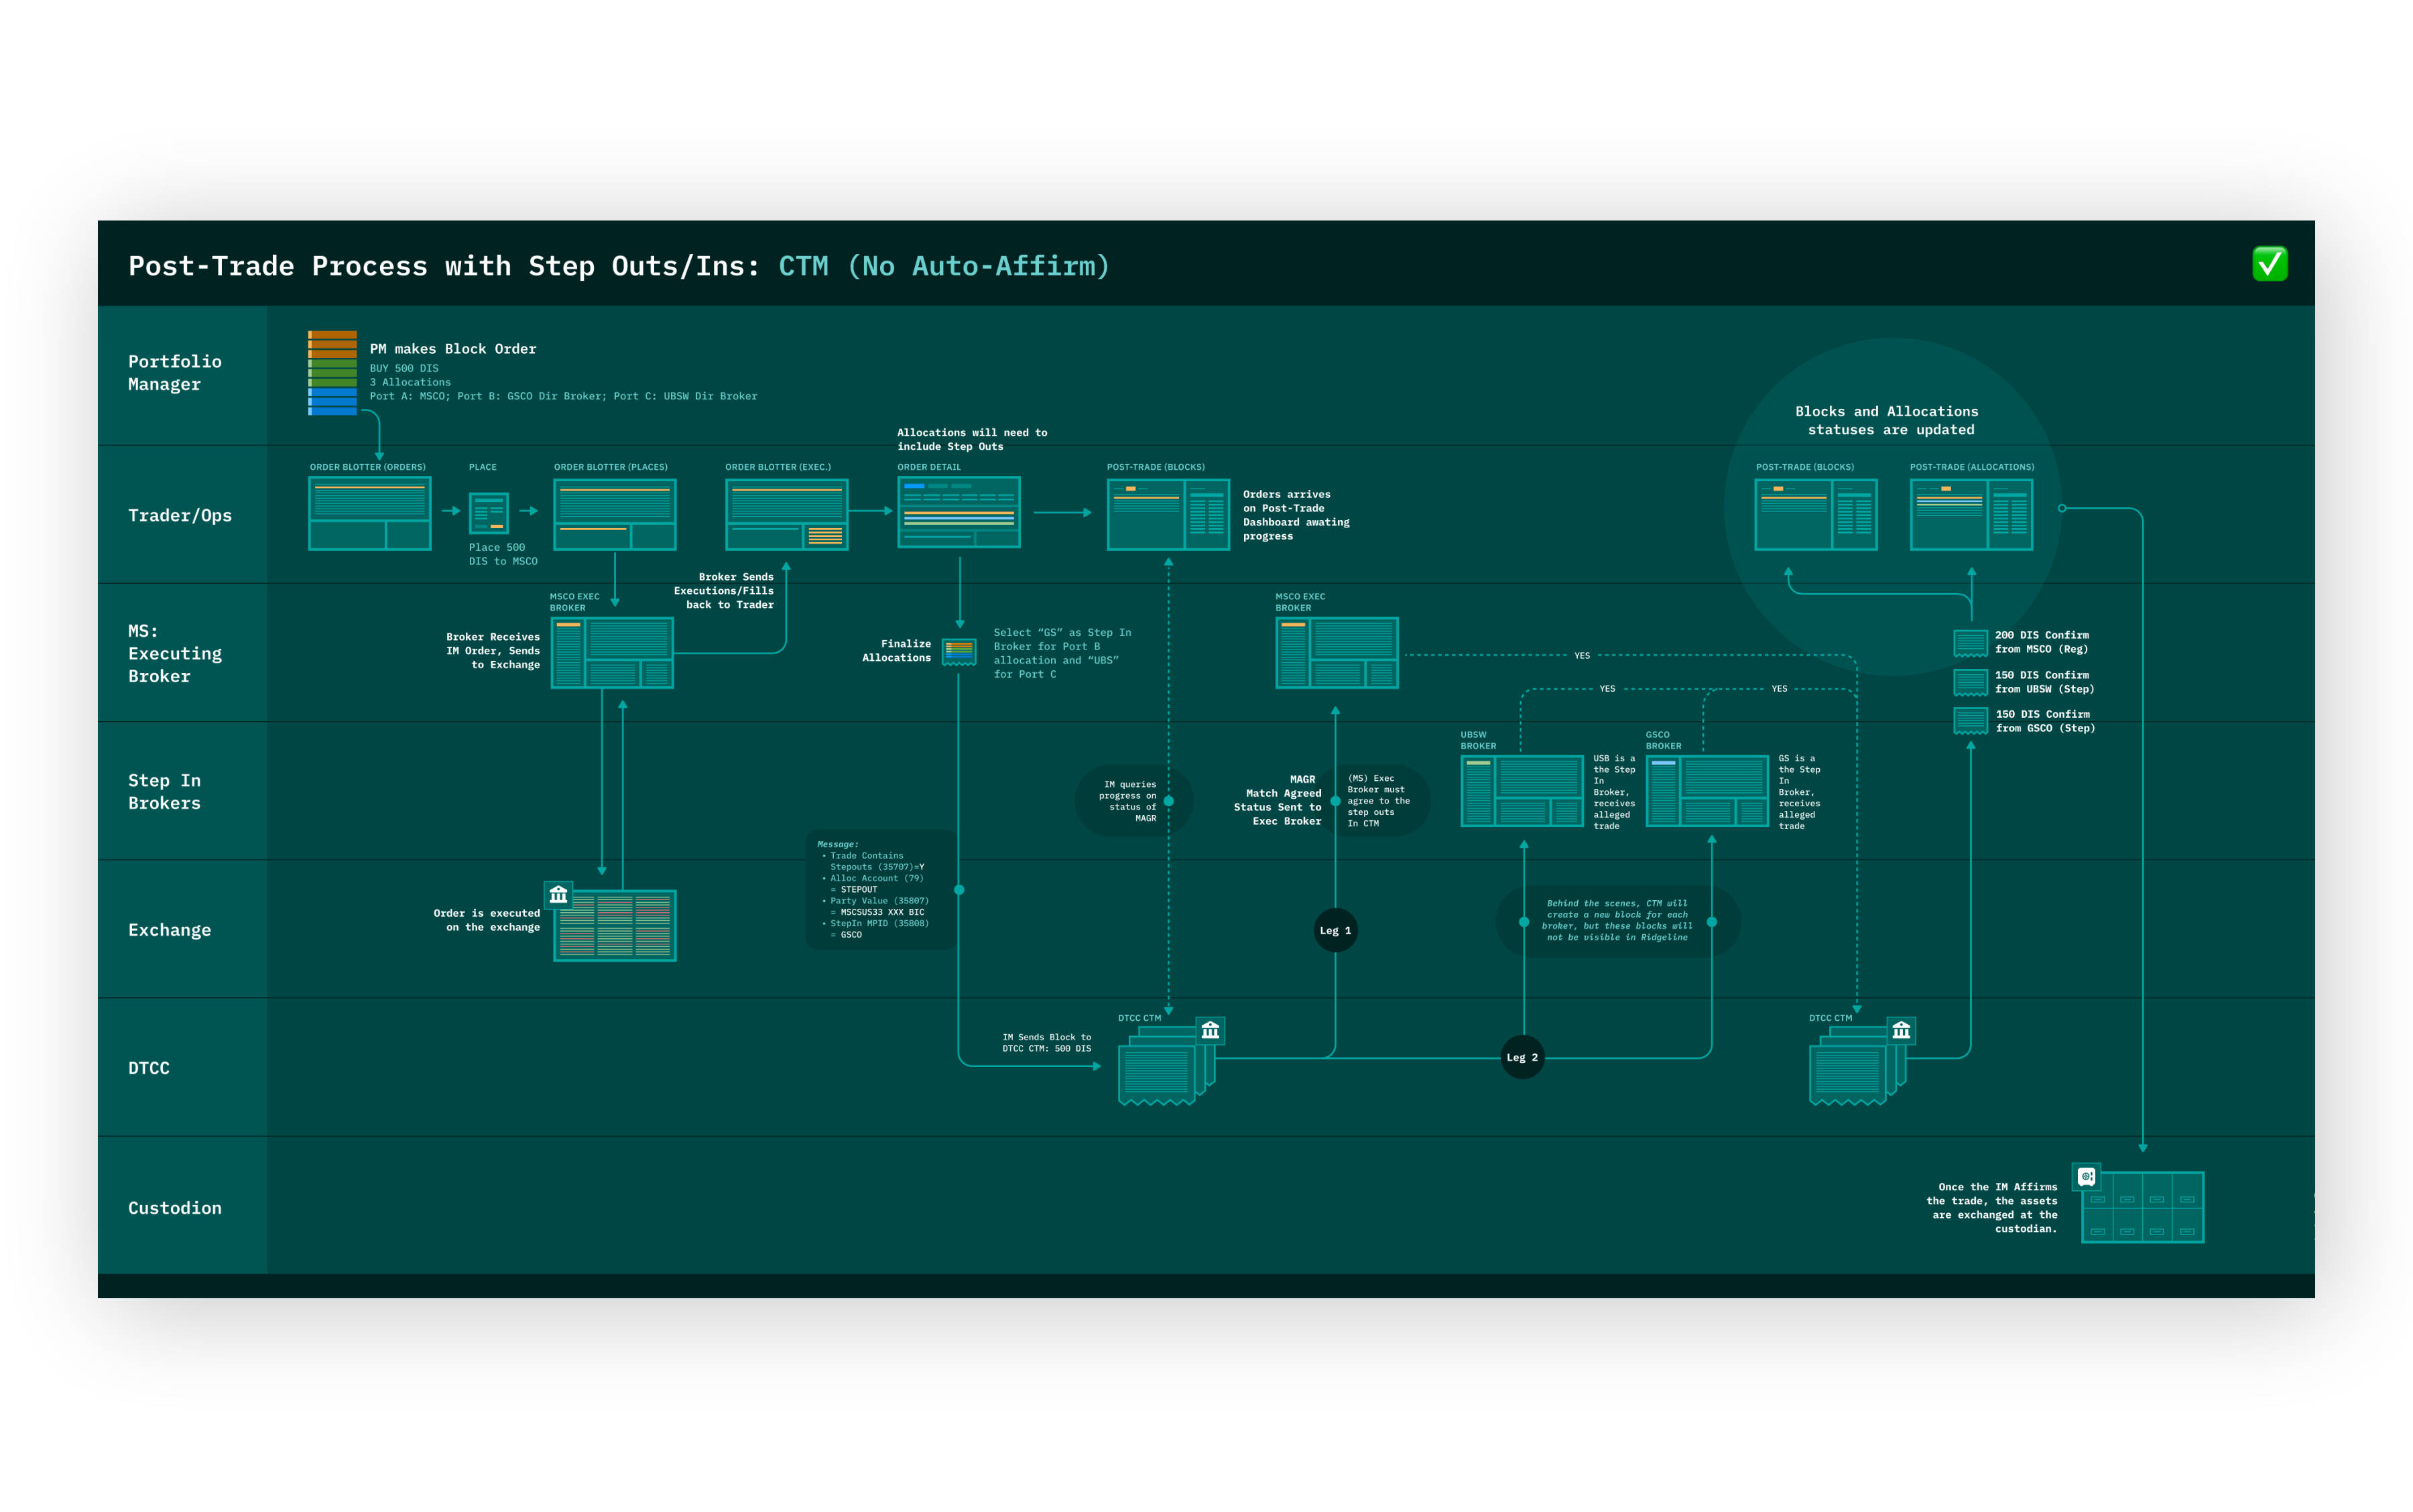
- After orders are created by a Portfolio Manager, they land in the trading blotter, which is the beginning of my vertical.
- The scope of my vertical is all trading features that are used by traders as well as post-trade features that are managed by trade operations.
- This flow diagram/app map format was adopted by other designers to show the scope of their verticals.
First Task: Designing a More Flexible and Performant Data Grid
- After having worked on a lot of data tables/blotters in my career, I immediately understood there were problems with Ridgeline’s implementation of the AG Grid third-party table throughout the platform, including beyond my vertical.
- I initiated an evaluation and put a plan together to make the most of AG Grid’s capabilities, and produced design artifacts to help support my case
- After talking to the design systems team, it was apparent that it would be too hard to get AG Grid to achieve the tasks we needed. They agreed to build a table system from scratch!
- For several months, I lead the design of a full table rebuild comprising cell style options, selections, filtering, column management, row grouping, and column data aggregations, as well as best practices for using the table in the platform.
- I eventually had to hand over the work to the design systems team to concentrate on my trading vertical.
Evangelizing Ticket Refinements – Standardizing Notifications & Messaging
- The trading tickets were designed before I had arrived at Ridgeline, but they were rudimentary and didn’t contain standardized contextual information, design formatting, or messaging
- For example, when you clicked on an order to open the trade ticket, it covered the order blotter but did not include order details such as instrument symbol, order type, or status.
- Additionally, when making a trade, certain conditions might relate to the order that are listed as information on the ticket. These could be simple rules, warnings, or errors. There was no hierarchy that made it easy to distinguish between casual information and important warnings or errors. I designed a framework for messaging and then made it applicable throughout the platform beyond just the trading vertical.
Adding Dynamic Algo Definition Language to Order Tickets
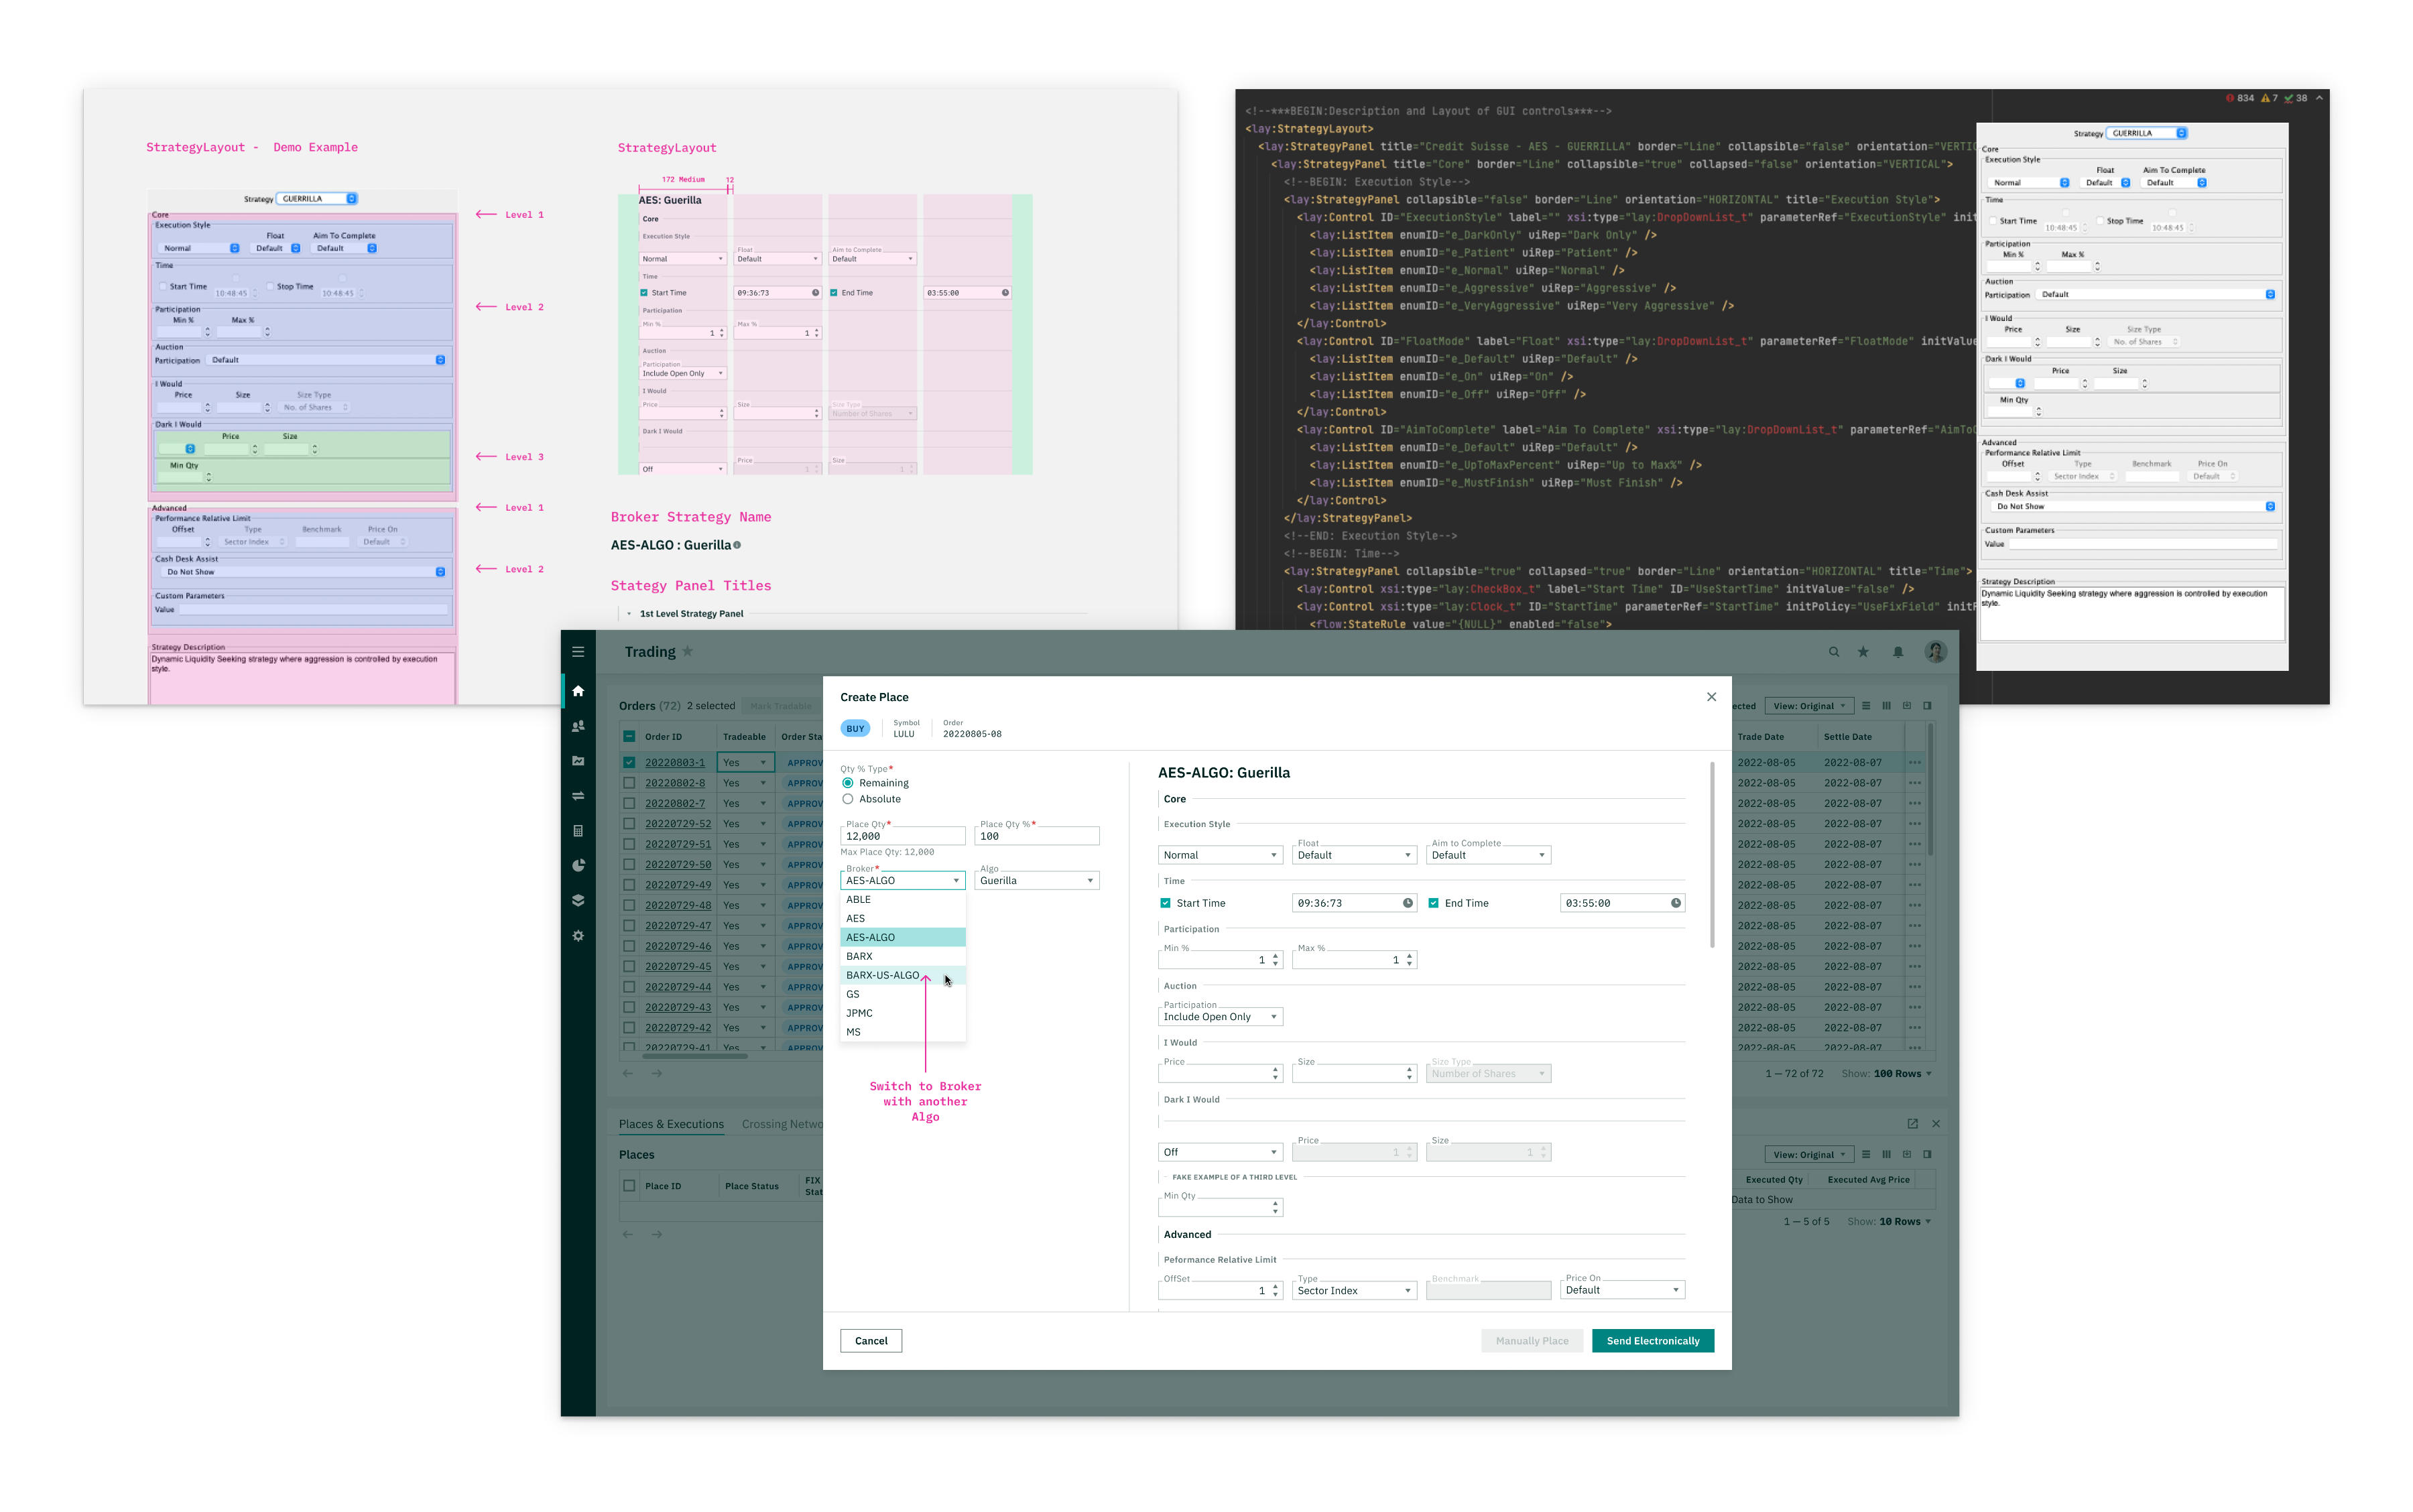
- Every broker has their own bespoke set of algos, a set of forms that allow orders to dynamically trade
- The goal here was to create a flexible design system that would allow any type of also form to be rendered generatively
- We had to analyze multitudes of algo forms to arrive at a solution that didn’t break the design system as well as the algo form hierarchy.
Post-Trade: Aligning Two Trade Reconciliation Features
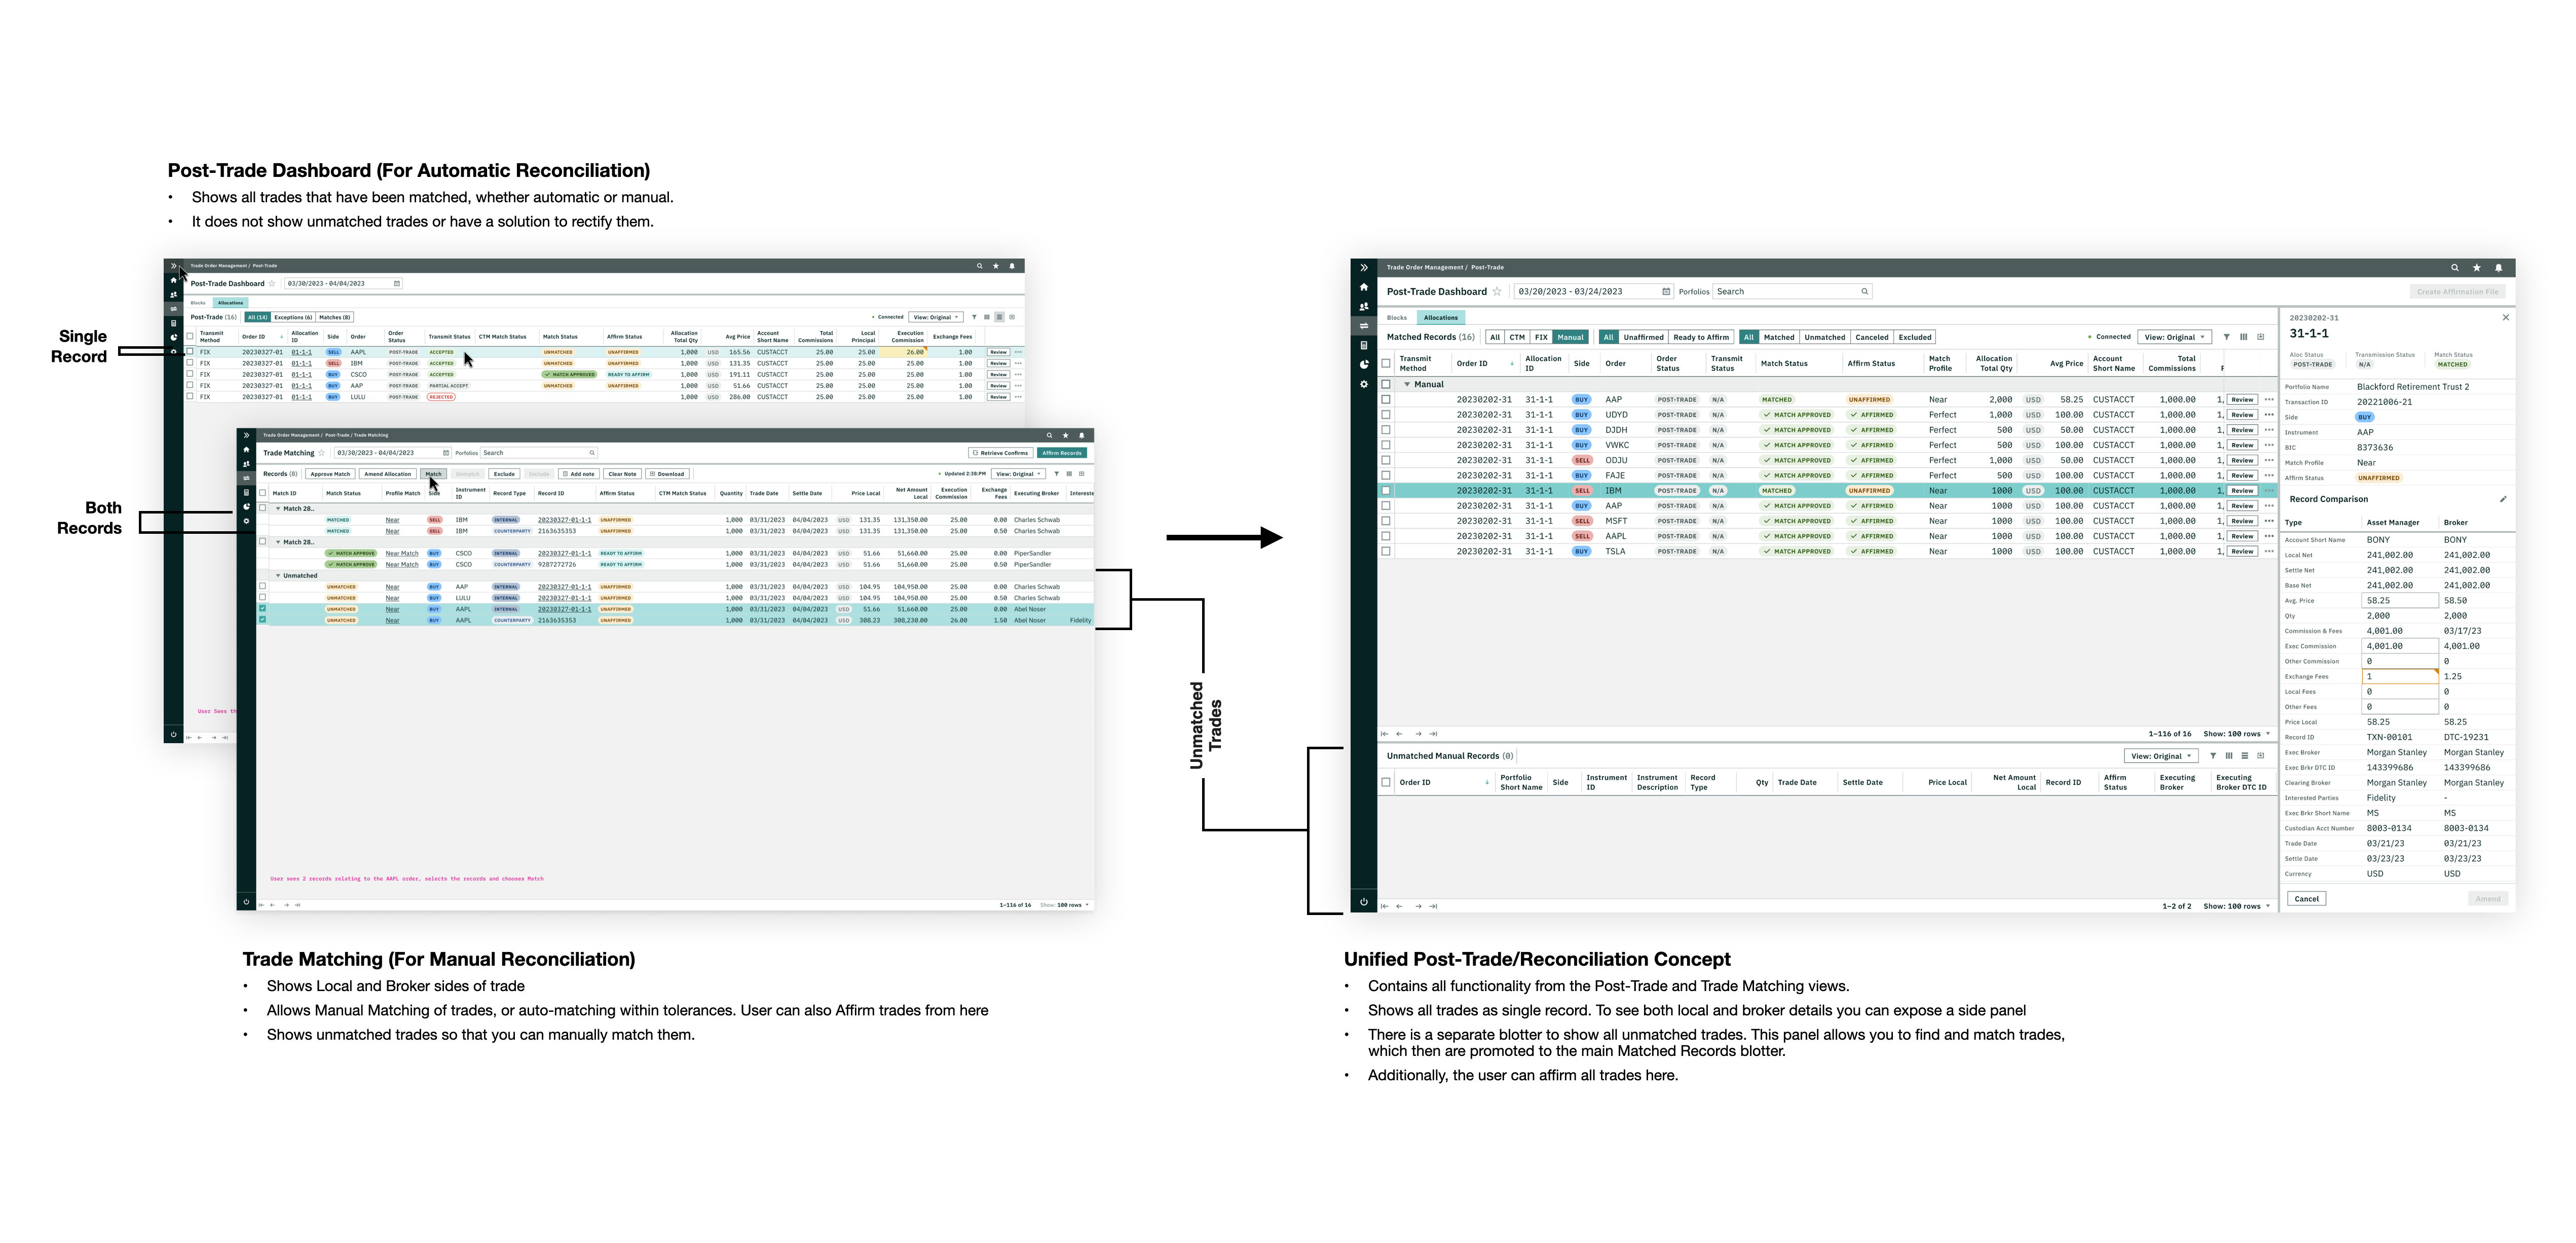
- A trade has two sides. In the case of a Ridgeline customer, they have a local side and an executing broker side. In the Post-Trade phase, the trade operations team matches the trade. Depending on the setup, this matching can happen automatically or manually. The goal is to match all trades, but sometimes not all trades are matched, so the trades need to be rectified.
- Ridgeline has two views that manages the matching of trades, “Post-Trade” and “Trade Matching”. One lived in the “Trading” vertical and the other in the “Accounting” vertical. Both views were then mandated to live in Trading. This was massive work for the dev team as the code was very different, but the views did pretty much the same thing.
- My goal was to unify the two views into a singular Post-Trade view. I encountered a lot of resistance on the unified view, so I created an interim system that would allow both views to work in sync and have almost the same functionality. This would allow the user to choose which version they wanted to use so that we can measure preferences across users.
Post-Trade: Designing Step-Outs with Google Sheets
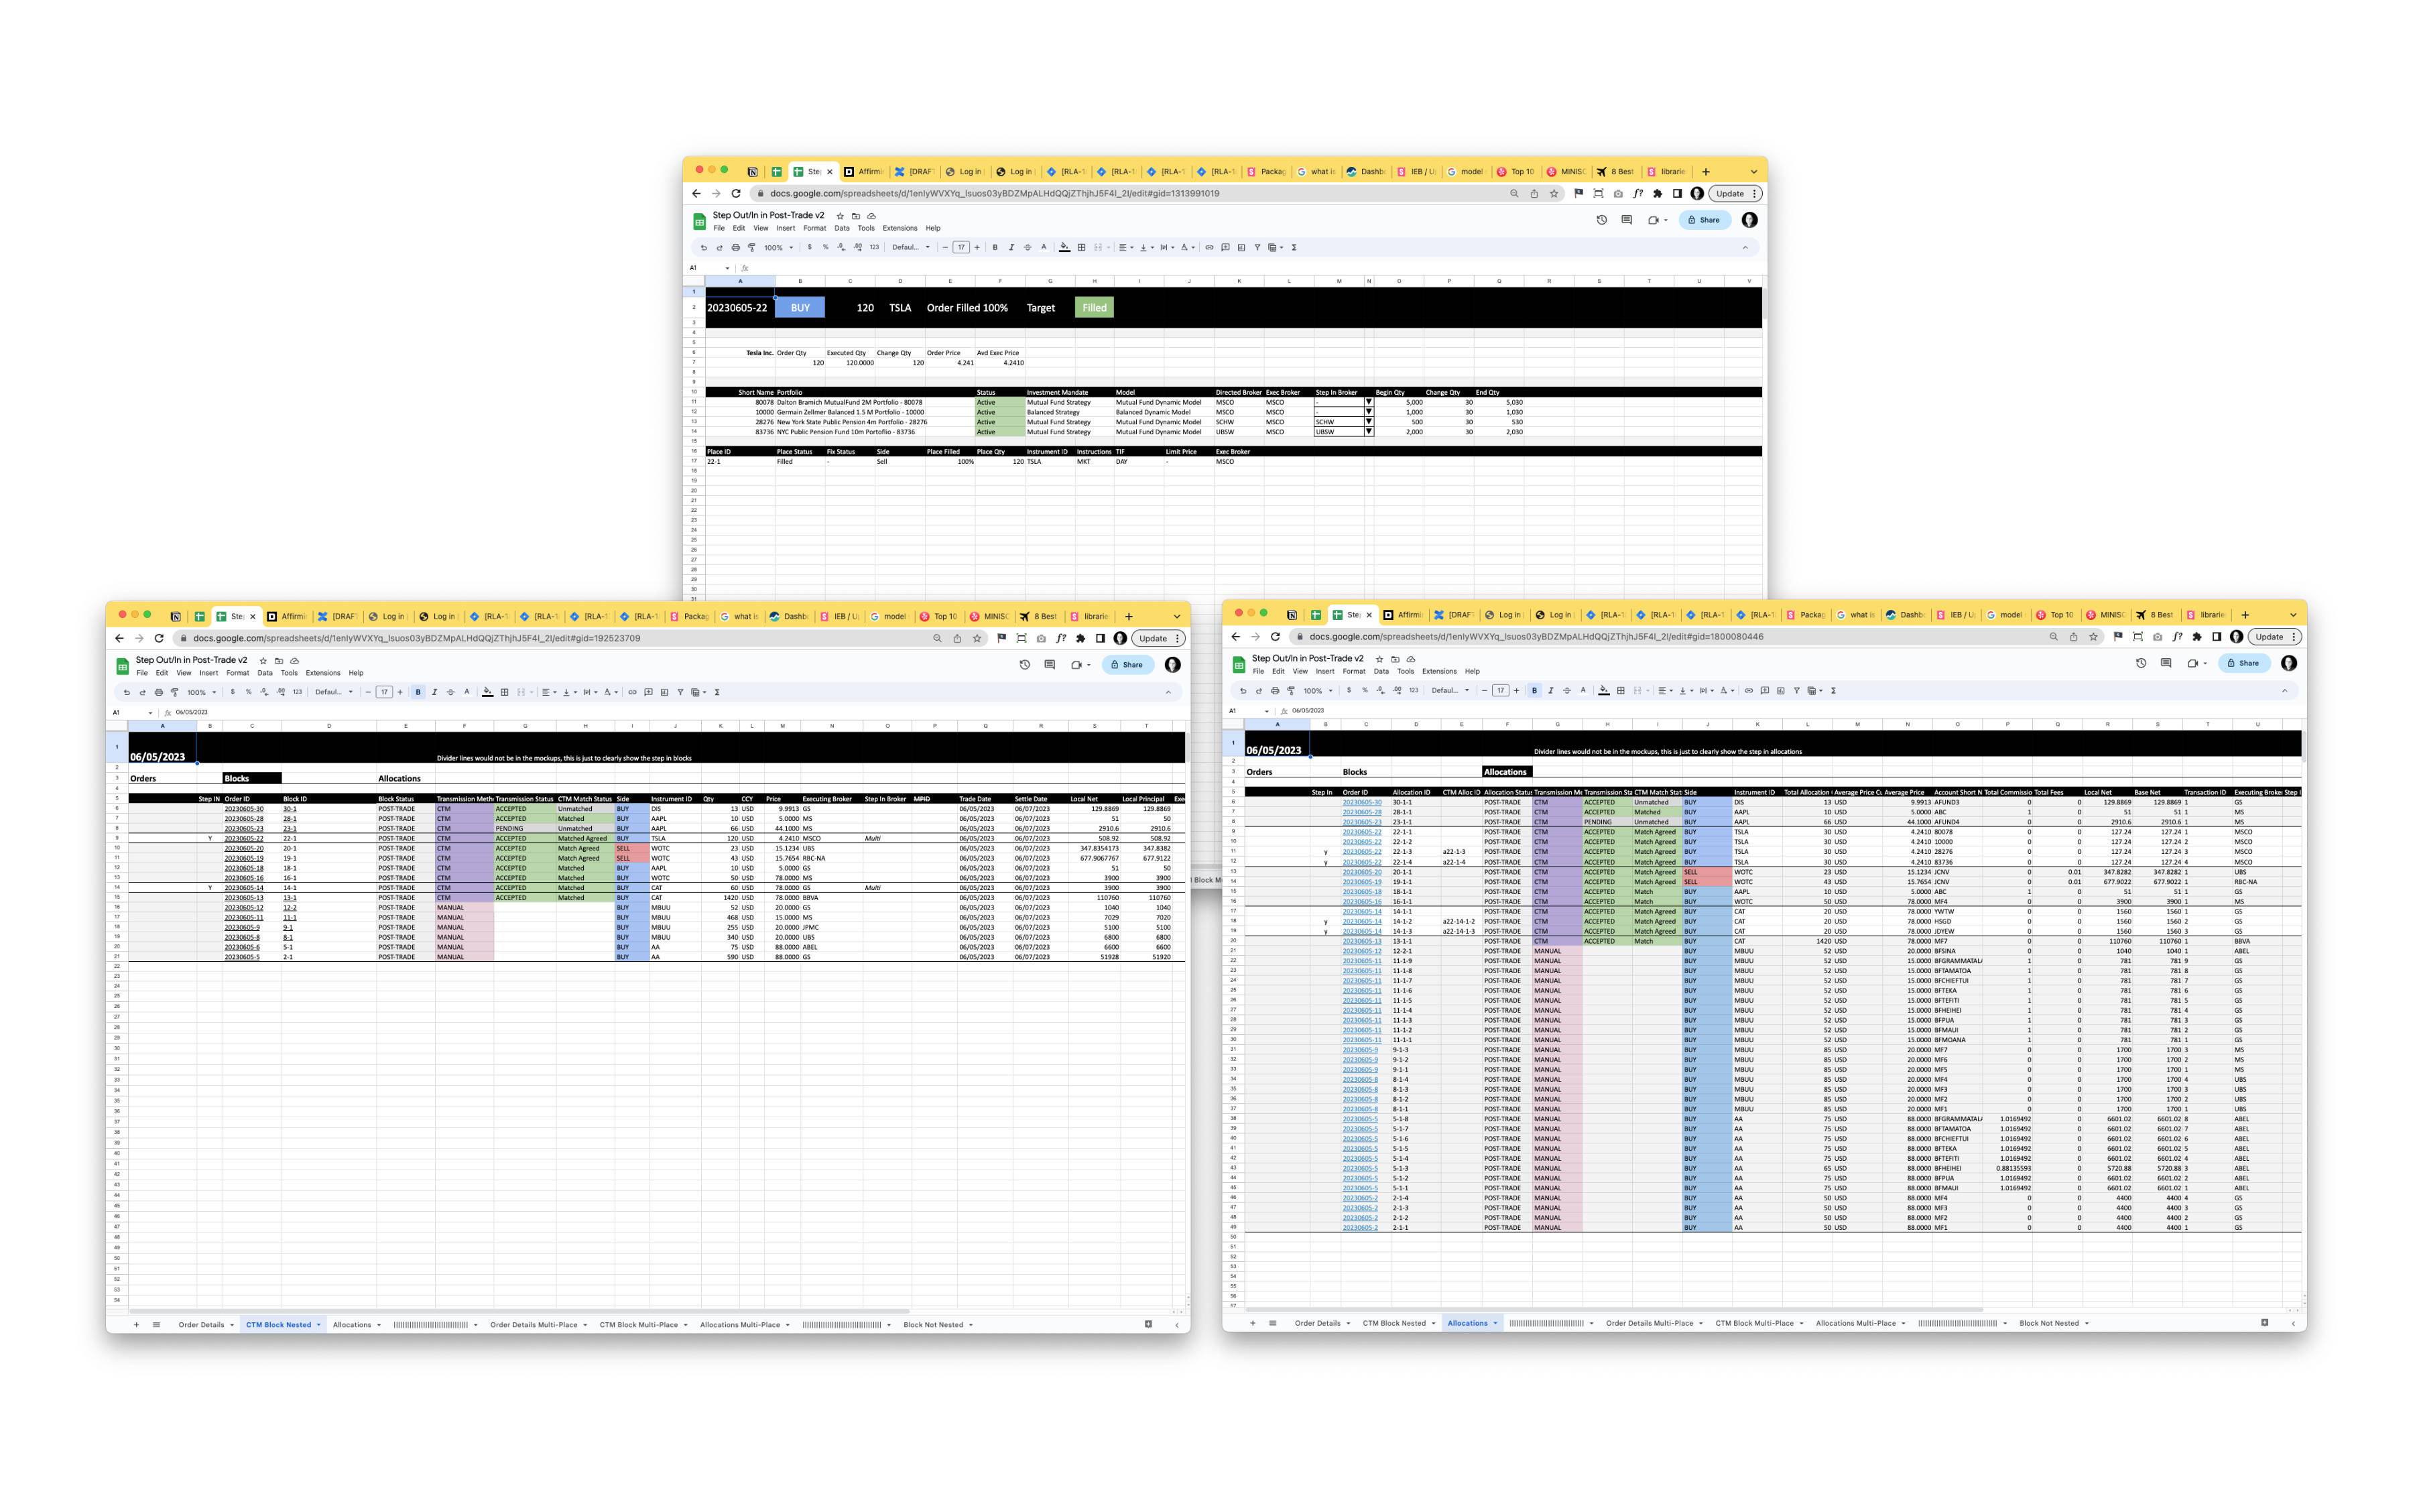
- During a trading day, if a trader has more than one order of a particular equity, they are obligated to group them to get better pricing. That means they trade the order with one broker. Sometimes an order comes with the stipulation that they trade with a particular broker. If you group a few orders, you might not trade with the stipulated broker, therefore you need to step-out part of the order to give commissions to the stipulated broker.
- This happens during the Post-Trade process, where the post-trade operations team will view this on a series of blotters, and need to find the step-outs easily, so they can modify order allocations to make sure brokers are getting the commissions they expect.
- This was a design task where we needed to have seemingly real mock data to validate if what were doing was correct. Working in Figma was too cumbersome to use real data, so I pivoted to Google Sheets to make the designs. I later created Figma mockups for developer hand-off once were validated the Google Sheet designs were good.
Assorted Business-As-Usual Features & Components
- Side-Panel Enhancement to Include Grids and Polish
- Trading with external trading system
- Dark Pool/Crossing Networks
- Mutual Funds
- Atomic Components